Step by step#
This time, the challenge is to déboguer (debug) an existing program,
that is, to identify, analyze, and correct an error hidden within it. This will be
an opportunity to learn how to observe the program’s step-by-step execution, in order to fully
understand how it works.
Note to teachers
Todo
Abnormal behaviors:
Breakpoint ignored in some cases
Code that does not update in the debugger
Fix: restart the kernel or stop / restart the debugger?
The page is long, hence a lot of back and forth. How to reduce this?
«Alternative via clic:» the learner may spend time testing when it is not necessarily relevant at this stage. And it consumes vertical space. Delete?
Run the two cells below to display the maze and run the program.
from laby.global_fr import *
Laby(niveau="1b")
debut()
avance()
droite()
avance()
prend()
avance()
droite()
pose()
gauche()
avance()
avance()
gauche()
avance()
droite()
ouvre()
You will notice that in the end, the ant is still carrying its pebble and therefore cannot
get out.
Use the labyrinth’s command buttons to follow the program’s execution step-by-step, forwards and backwards, etc., to fully understand what the ant is doing.
At this point, you have probably already identified the problem. However, it is not
obvious to link each of the ant’s actions to the corresponding program line.
To overcome this, we will use the debugger.
Activate the debugger by clicking on the insect (bug in English) to the right of the control bar at the top of this page:

The insect turned red, line numbers appeared on the left in the code cells, and a palette opened to the right of this sheet.
The debugger allows you to set breakpoints in the code: the execution of the
program is paused each time it reaches a breakpoint.
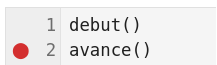
Add a breakpoint on the second line of the program by clicking to the left of the line
avance():
Todo
Un utilisateur était bloqué en ne cliquant pas assez à gauche. Refaire la copie d’écran avec un curseur de souris?
Run the cell containing the program.
You will notice that the ant is in the starting position and that the execution is in progress
(as indicated by the asterisk in brackets [*] to the left of the cell): the execution
is paused on the breakpoint line, just before the execution of that line.
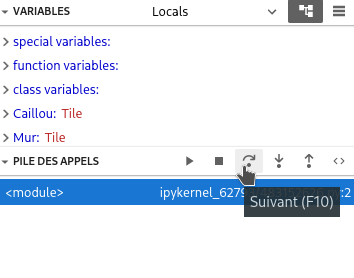
Press the F10 key (on some keyboards: fn+F10) to advance one step to the next instruction. Alternatively, you can click the arrow in the
PILE DES APPELSarea of the palette on the right.
Continue pressing
F10and observe the program’s step-by-step execution. To restart the program from the beginning, execute the cell again.Analyze the error and correct it. Relaunch the step-by-step execution to verify.
Click on the bug icon to deactivate the debugger.
Hint
If the debugger exhibits erratic behavior (breakpoint ignored, …): click twice
on the bug icon to disable the debugger, then resume from step 3.
Conclusion#
In this sheet, you have executed step-by-step a program to observe and
precisely understand its operation. This is an effective strategy to implement
whenever you have a doubt to predict the behavior of a program, especially
to debug errors.
You have also discovered the essential commands to use the debugger.
Available in Jupyter and any good development environment, it is a tool of
choice to help you implement this strategy.
As you tackle more complex programs, you will refine your
observation strategies and become familiar with the wealth of observation features
offered by the debugger, especially via the right panel in Jupyter.